| Raw Data | Processed Data |
| + readings or measurements taken directly from a measuring instrument (e.g metre rule, stop watch) + readings must be expressed to a fixed number of d.p dictated by the units used and the precision of the instrument. E.g 15.0 cm or 0.150 m when recording the measurements using metre rule. | + readings obtained from computation of the raw data (e.g finding the period of the pendulum) + All processed data must be expressed to a fixed number of d.p or s.f depending on the operation (addition/subtraction & multiplication/division) of the raw data. |
PRECAUTION
When writing precaution for the experiment, you need to provide precaution that helps to provide better accuracy to the data and not about safety of the person who is performing the experiment. For instance, precaution for placing pins in glass block experiment is to ensure that the pins are at least 5.0 cm apart instead of stating that you should be careful to not prick your fingers. Having pins 5.0 cm apart will help to ensure that the pins and their images are really aligned on a straight line.
Commonly used instruments and their precisions


For example, the instruction in the question paper states to measure 80 ml of water using measuring cylinder. Then, the correct recording is 80.0 ml or 80.0 cm3.
Why are some values read to the smallest division and some to half the smallest division?
Values obtained using a single judgement is called a ‘reading’.
The uncertainty in a reading when using a particular instrument is no smaller than plus or minus half of the smallest division or greater, e.g., a volume measured with a measuring cylinder is likely to have an uncertainty of ± 0.5 cm3 if the graduations are 1 cm3 apart.
Values obtained using the difference between the judgement of two values is called a ‘measurement’. As both ends of the ruler have a ± 0.5 mm scale division uncertainty, the measurement will have an uncertainty of ± 1 mm division. This “initial value uncertainty” will apply to any instrument where the user can possibly set the zero but will not apply to equipment such as balances or thermometers where the zero is set at the point of manufacture.
Table
For table, a few rules of thumb to follow. Raw data follows the precision of the instrument used. Processed data column follows the s.f of raw data used. It’s fine if your process datas have different s.f. Heading of the table must contain proper unit using solidus. For those more visual learner, you can refer to the picture below.

Some other examples of table (figures below for this section are taken from Handbook for teaching science practical work by Singapore MOE, CPDD, Science unit, Science Branch):


How many data sets should I collect?
At least 5 data sets for a best-fit line and at least 8 sets for a best-fit curve.
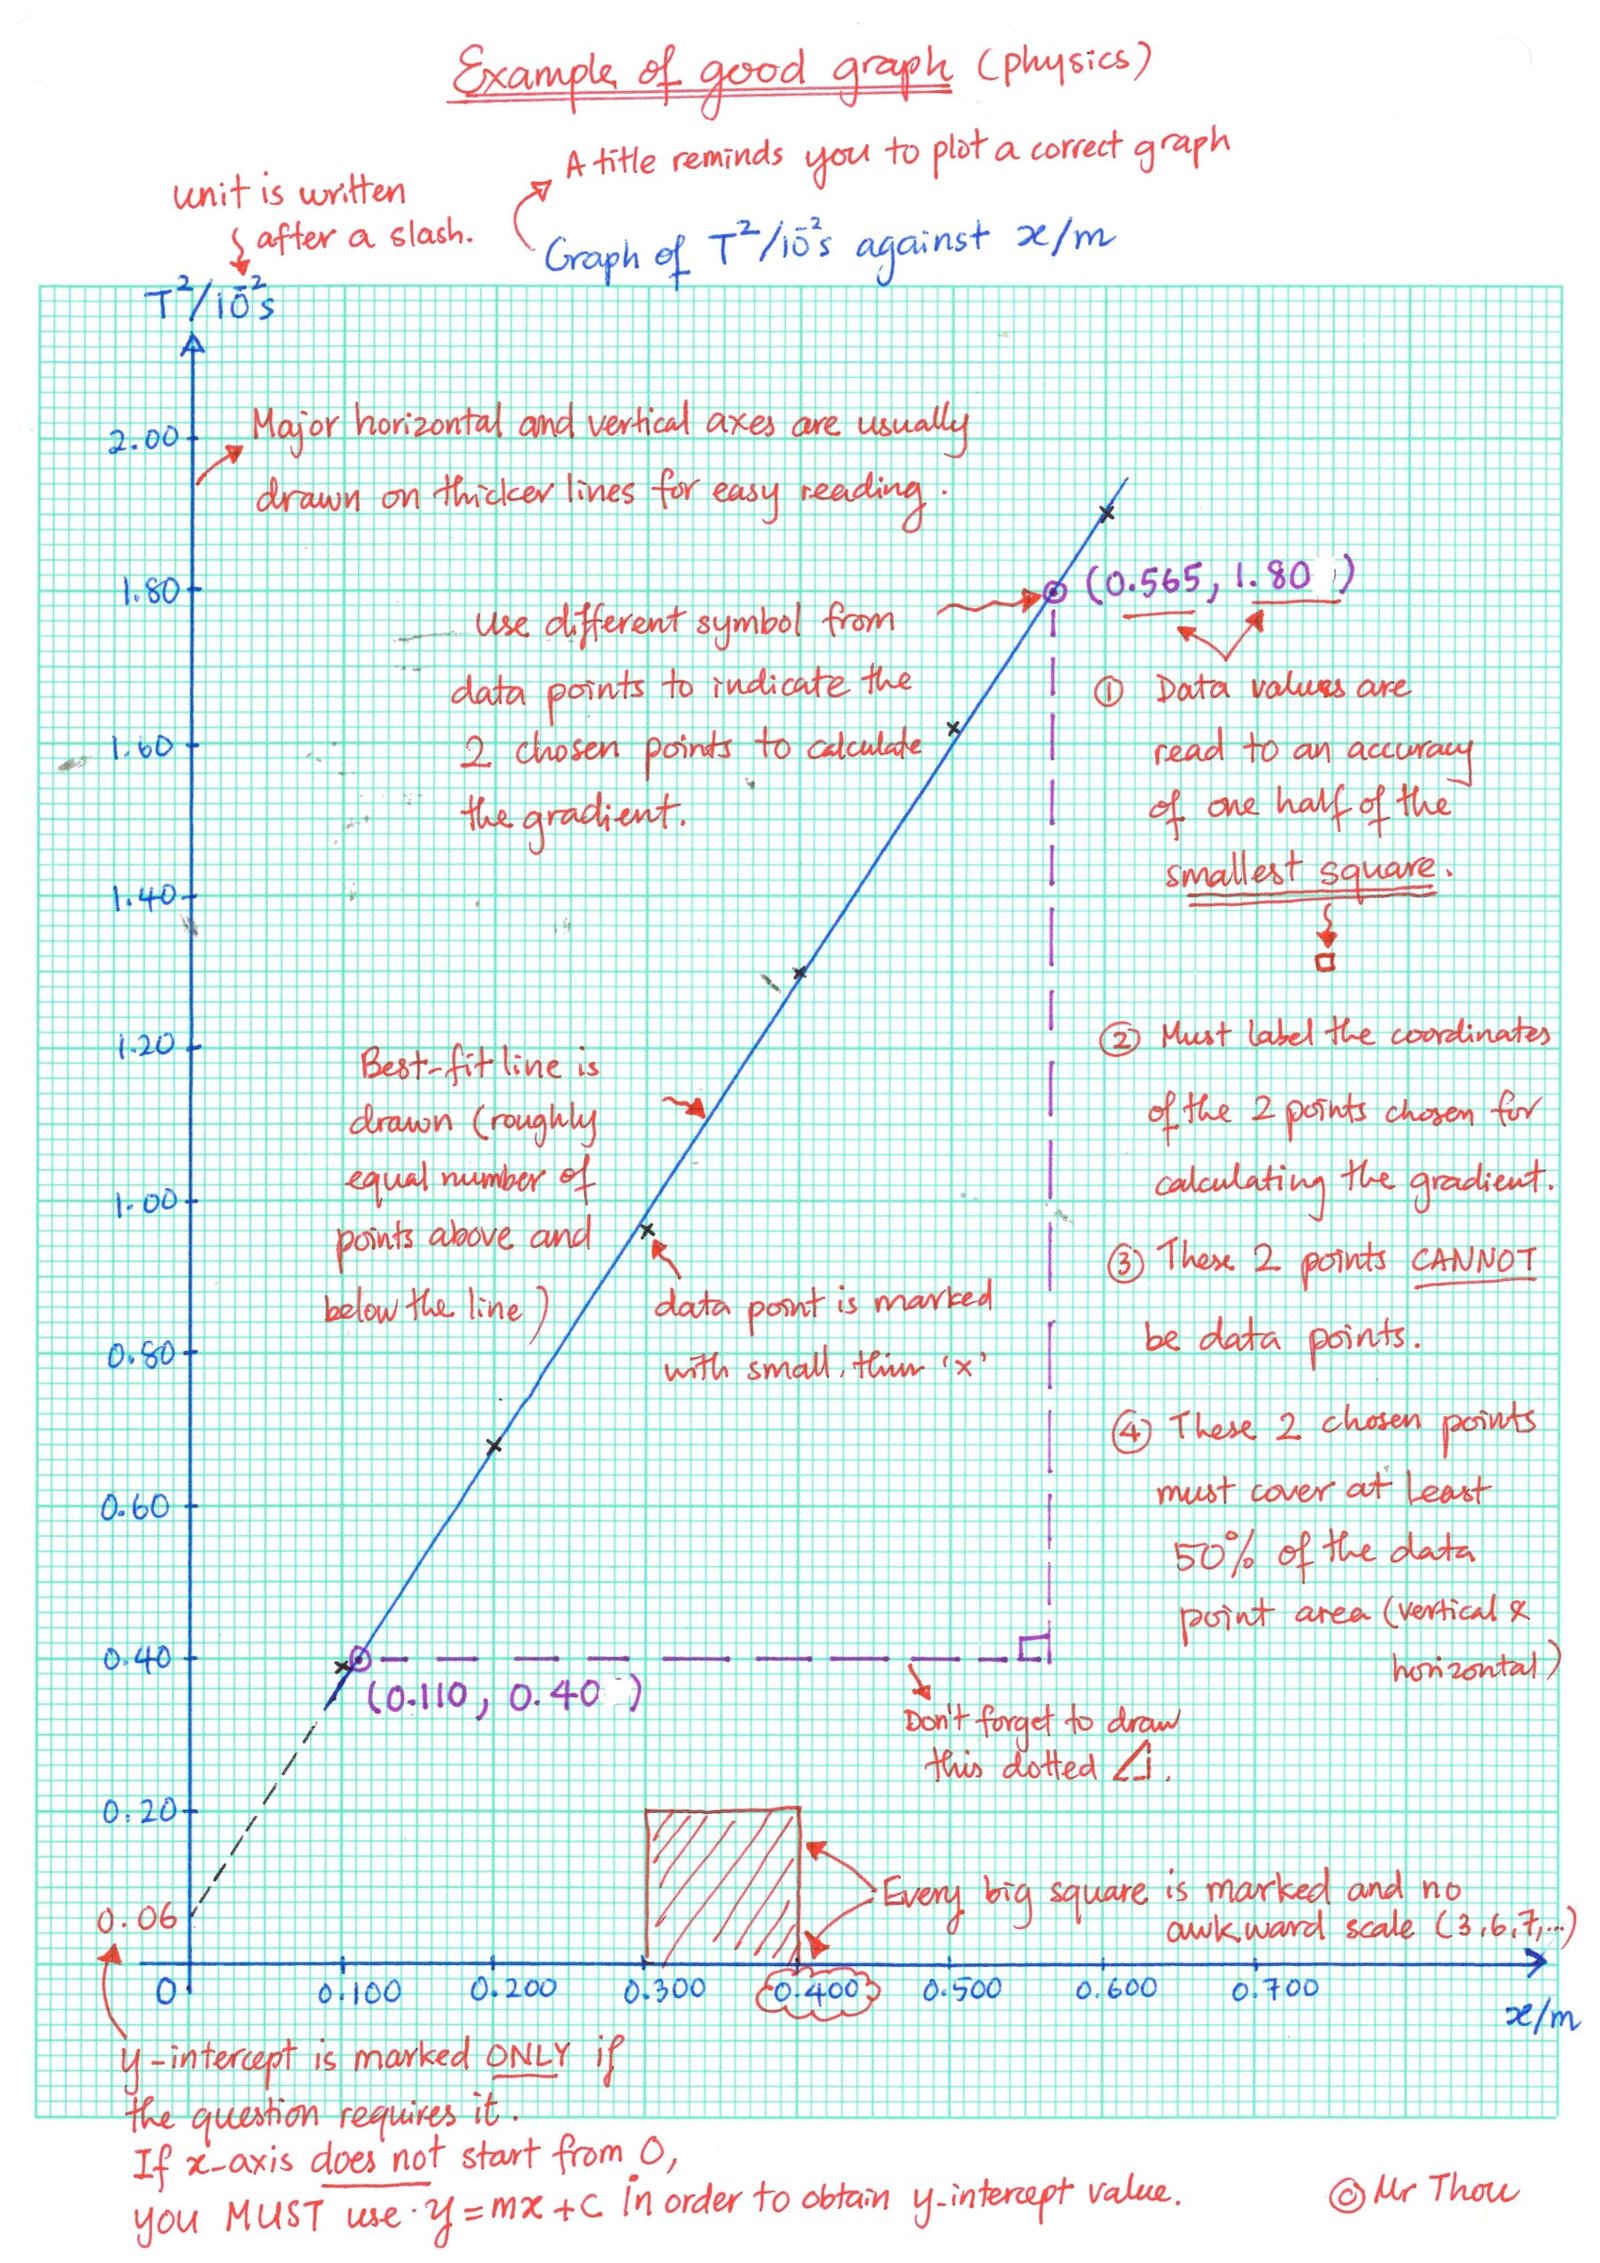
Graph plotting
You can use SLAP acronym to guide your plotting.
S: Scale – no awkward scale such as 1:3; 1:7; 1:9 ratio etc.
L: (best fit) Line. Download this excel file and practice drawing a best-fit line. Rule of thumb: equal number of data points above and below the best fit line. However, it is not always possible.
A: Axes labeling (must include unit using solidus if applicable)
P: Point (points are plotted accurate to one half of one of the smallest square)
How do you know if your graph is a best-fit line or best-fit curve?
It’s useful to read the following parts of the question. If the next part of the question is asking you to find the gradient without specifying exactly at which coordinate, then it has to be best-fit line. Only a line has the same gradient throughout. It might be a smart move to check this out so that you will know how many data points to collect and decide on their range as well.
Selecting points for calculating gradient
- Two selected points must be apart for at least 50% of the raw data points. They cannot lie beyond the data points in both directions. A different symbol should be used to indicate these two points, so that marker doesn’t get confused between data points and the chosen points for gradient. It’s possible to choose data point if the data point lies on best-fit line. But you need to remember to read this value to one half of one of the smallest square.
- A triangle tracing should be drawn.
- Their coordinates must be indicated on the line and read to one half of one of the smallest square.
How should I calculate my gradient?
Coordinates must be read off to at least one half of one of the smallest square. The value of gradient can be written to 2/3 s.f with unit (if applicable).
How should I read off my y-intercept from the graph?
Read off to the accuracy of one half of one of the smallest square.
Types of Errors
There are two common types of errors that affect results – random errors and systematic errors.
- Random errors arise when an observer estimates the reading on an instrument. They are inevitable but can be reduced by taking a large number of readings and averaging them.
- Systematic errors cause readings taken by an observer to consistently deviate from the true values. This could be attributed to existing zero errors in the instruments or caused by environmental factors such as hot weather on a particular day. Averaging does not reduce systematic errors. They can be corrected if the observer can identify the causes of errors.
Identifying Errors
Some guiding questions may be helpful to identify where errors may be introduced.
- Which experimental procedures were difficult to carry out?
- Which measurements were difficult to observe and record accurately?
- Other than the measured variables, what other factors could have affected the results?
Suggesting Improvements
The improvements suggested must be able to address the sources of errors identified, and they can include modification to experimental procedures, more rigorous control of variables, or the use of more accurate measuring instruments and/or procedures.
Eg. Suggested improvement for an electrical experiment
Source of error: The resistance wire is not taut/straight which results in an inaccurate measurement of the length of the wire. This in turn affects the measurement of the resistance of the wire.
Suggestion for improvement: Use a resistance wire that has no kinks, i.e. perfectly straight. This will lead to a more accurate measurement of the length of wire.
SUGGESTED SOURCES OF ERROR AND POINT TO NOTE
Pendulum experiment
Sources of error
- Error due to human reaction time. To improve accuracy, take repeated readings & find the average.
- Position of the centre of the bob can only be estimated, thus length of pendulum cannot be accurately measured. Place the eye closer & at the same level as the centre of the bob so as to avoid introducing parallax error in the measurement.
Thermal experiment
Sources of error
- Heat is lost from the metal block when it is transferred from the beaker of boiling water to the tap water.
- Some heat is lost from the styrofoam cup through conduction and convection during the process.
Points to note
- Avoid using a thermometer as a stirrer unless you are permitted to do so.
- Try to estimate temperature reading to 0.5 oC.
- Avoid parallax errors when making temperature readings by reading the scale with the eye at the same level as the meniscus of the mercury column.
- Take reading only when a steady condition is achieved.
- To measure the temperature of a heated liquid, stir the liquid continuously to make sure the temperature is uniform throughout the liquid.
- Place the thermometer vertically in the middle of the container so that it does not touch the sides or bottom of the heated beaker.
- Carry out the experiment away from draughts or wind.
Light experiment
Sources of Error (glass block, mirror)
- The holes made by the pin (applicable for optical pins) are rather large, thus affecting the accurate construction of the paths of incident and emergent rays.
- The exact positions of P3 and P4 which coincide with the positions of image P1 and P2 when viewed from face mirror are affected by using thick pins.
- Due to the size of the trace, the pins could not be placed far apart. This may cause inaccuracy in the location and measurement of ….. rays.
- The mirror is very light and shifts easily despite checks. This can cause error in the angle of incident and hence the ….. ray.
- Pin cannot be placed exactly at the outline of the block due to thickness of the pin……
- Though eye is placed close to the correct position of observation, it may not exactly be the same throughout the experiment.
- Difficulty in ensuring that glass block is put back at the exact location after each reading. This will affect the positions of pins P3 and P4 and thus the measured refracted angles.
Sources of Error (lens)
- There exists a small range of v for which the image is still in focus which may lead to an uncertainty in the measurement of the focal length.
- The object is not in line with the centre of lens, thus the focal length obtained may not be the principal focal length.
- The middle of the lens holder may not coincide with the centre of lens & thus causes error in the measurement.
- Images that are large are not sharp. The result of v may not be accurate.
Points to note
- Lines are drawn as continuous lines to obtain ……
- For accurate measurement of i and r, eye must be placed directly to the markings on the protractor so as to avoid zero error.
- Pins are inserted vertically and each pair of pins are > 5.0 cm apart to reduce human error (parallax error) so that the reflected ray located is more accurate.
- Pin holes are small and lines drawn are thin.
- Mirrors are placed vertically with their silvered surfaces on the lines drawn.
- Use the plasticine to secure the mirror to holder to prevent it from moving so that the point of incidence is fixed, hence the angles of reflection obtained can be accurate.
- Close one eye to locate the image and position the pins in order to locate the image accurately.
- Use optical pins that are straight and not bent in order to locate the image position accurately.
- Pins should be placed upright & observed from the base when aligning them in a straight line for a more accurate location of the image.
- Lens must be placed vertically upright with its vertical plane perpendicular to the principal axis.
- Object distance & image distance should be measured along a line parallel to the principal axis.
- Place the illuminated object the same height above the bench as the centre of the lens.
- Do not shift the object and screen when determining value of each set of readings.
- Ensures that lens rests vertically on the lens stand.
- Angles measured to the nearest degree.
- Use a metre rule to guide when shifting the lens to ensure the entire illuminated object can be focused on the screen and hence formation of a sharp image can be accurately obtained.
- For experiments involving lenses, arrange the object, the lens & the screen to be vertically upright, parallel & coaxial to one another.
- Ensure that the laboratory is dark by closing the curtains and turning off the lights so that the image formed on the screen is visibly brighter.
Moment Experiment
Sources of Error
- The load provided may not have an exact mass of 50 g or 100 g. This affects the accuracy of the calculated values of the anti-clockwise and clockwise moments in the experiment.
- The c.g. of the weight is estimated, thus it may affect the readings for distances….
Electricity Experiment
Sources of error
- Wire becomes hot after some time and thus affecting the accuracy of …
- Kinks in the wire and thus wire cannot be straightened on ruler and this affects the length…
- Wires are not of uniform thickness thus the readings taken at each point may not reflect the actual values
- Contact of jockey is not consistent thus causing some variations in the reading of …..
- Fluctuations of the pointer making it difficult to obtain the accurate value of ……
- ……. cannot be measured accurately because there is no scale on the mounting board/bench
Points to note
- Jockey is placed perpendicularly on the wire
- Ensures good contact at joints of wires
- Ensures that readings for ….. and ….. are taken without removing the jockey