What you must understand
- Sound is a form of energy that is transferred from one point to another as a longitudinal wave.
- Production of sound: vibrating sources placed in a medium.
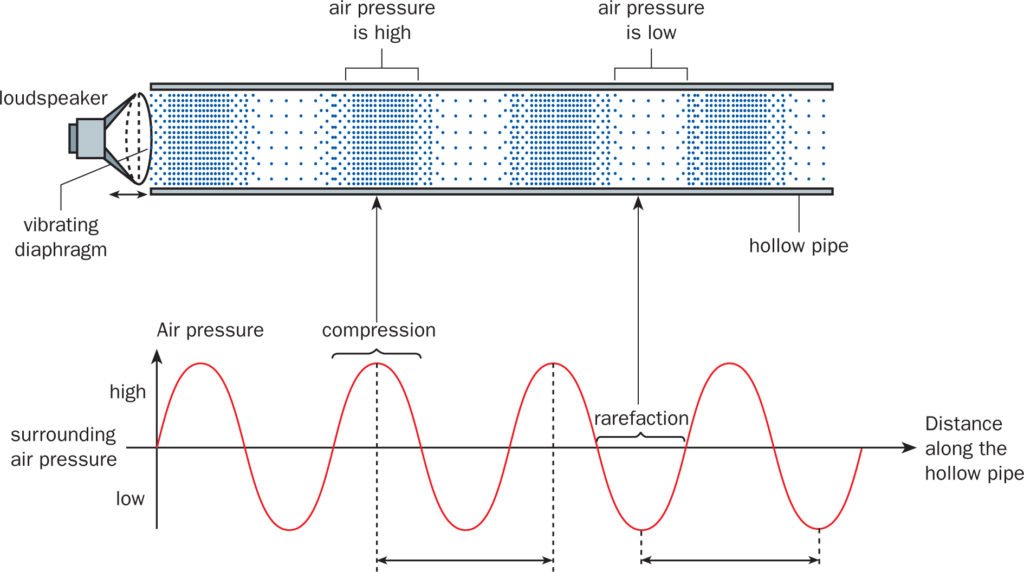
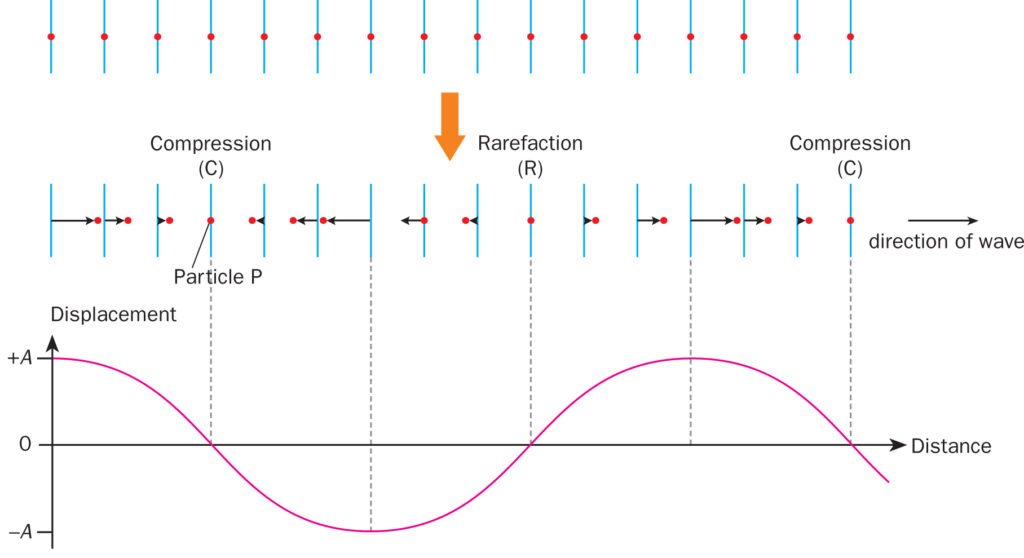
- Transmission of sound: sound travels as a series of compressions (C) and rarefactions (R) in the medium. The particles simply oscillate back and forth about their individual equilibrium positions, and this displacement (oscillation) causes the sound waves to travel.
- Compressions are regions where air pressure is higher than the surrounding air pressure.
- Rarefactions are regions where air pressure is lower than the surrounding air pressure.
- Sound needs a medium for transmission
- For echo, the loudest reflected sound is detected when angle of incidence equals to angle of reflection.
- Pitch IS NOT frequency of a sound wave. Pitch is an auditory sensation of the frequency. The higher the frequency, the higher the pitch. Pitch is relative!
- Loudness is related to the amplitude of a sound wave – the large the amplitude, the louder the sound.
- Waveform is a curve showing the shape of a wave at a given time.
Visualisation of Compressions and Rarefactions in Pressure-Distance Graph

Displacement-distance graph of the particles in a sound wave
- At a SINGLE instant, time freezes and we look at the amount of displacement by ALL the particles from their equilibrium positions.
- The shape of corresponding displacement-distance graph (based on the longitudinal movement of particles) is sinusoidal graph.

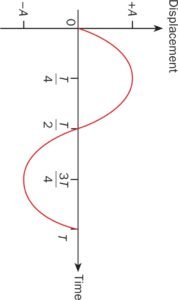
Displacement-time graph of ONE particle in a sound wave
- To visualise this scenario better, you can try drawing a straight and keep drawing the same line back and forth while having someone pulling the paper that you are drawing at constant speed to represent the linear change in time of our time system.
- You can also simply trace out the positions of the single particle by joining them with a single curve (sinusoidal) on the first diagram, and you will get the shape of the second graph (displacement-time).


